D04
Detection and attribution of anthropogenic drivers in extreme events
PD Dr. Petra Friederichs
University of Bonn | +49 228 73-5187 |
Till Fohrmann (PhD student)
University of Bonn | +49 228 73-5183 |
Summary
The collaborative research center’s integrated modeling system enables physically consistent simulations of the whole water and energy cycle. Our aim in this project is to investigate to what extent this improves the representation of extreme events. Our focus here is on meteorological droughts and heat waves. We compare the characteristics of extremes in the integrated modeling system with observations and reanalyses. Additionally, the impacts of different scenarios on simulation results will be addressed to attribute the extreme behavior to different forcings. Using the comprehensive representation of the water and energy cycle in the modeling system, we are especially interested in human influence, specifically changes in human land and water use.
Contribution to the CRC
Apart from providing a basic catalog of events, our work expands the other analyses done on the outputs of the CRC by a thorough statistical investigation of extreme events. Based on this, we can inform the project partners about the quality of the simulation with respect to extremes and changes in extremal patterns and their possible causes. This information can be used to improve the modeling efforts, e.g., check the effect of the addition of irrigation in D03 on extremes like heat waves and droughts. The high socio-economic impact of such events makes regime shifts, e.g., in intensity or frequency, of meteorological extremes important to economic modeling efforts in the CRC.
Approach
The first step in this project is to compile a catalog of extreme events. Based on this, specific events can be chosen for closer inspection. To make statistical analyses feasible, we expand the existing simulations by additional ensemble members and alternative scenarios. The latter is the key step to test the effects of different forcings. We look for changes by extracting compact descriptions of the extremes to limit the degrees of freedom of the comparison problem. If a large enough difference is visible, we can then compute the likelihood for the scenario being the cause of the changes. One example are the TerrSysMP simulations provided to us, which are run with and without human water use. In that case we can look for a change in extreme behavior, which could be explained by the water use, but might require an ensemble if one wants to look at specific events.
Main Results in 2022
A collection of extreme heat waves and droughts has been assembled. It compares the results of analyzing the time frame between 1995 and 2019 using the “Extremal Pattern Index” with the collection of reports done in the ClimXtreme project. Times spans, region and special characteristics of the events are available.
Main Results in 2023
In our second project, we look at the impact of heat waves onto the boundary layer height. The hypothesis is that the high temperatures should cause exceptionally high boundary layers. This could have important consequences for the onset and persistence of heat waves. Our goal is to perform a comprehensive investigation, which is why we chose to use reanalysis products as our main data source. The first challenge here was to choose and implement an appropriate heat wave definition. We again use the „Extremal Pattern Index“, because the approach also allows us to compare extremal patterns for temperature and boundary layer height. As established methods did not prove effective for estimating the boundary layer height for COSMO-REA6 reanalysis data, a machine learning based approach was developed and applied. A comparison of the development in maximum daily boundary layer heights in COSMO-REA6 for a heat wave in August 2014 against normal conditions can be seen in Figure 1. An increase in boundary layer height can be seen in many cases on a heat wave scale.
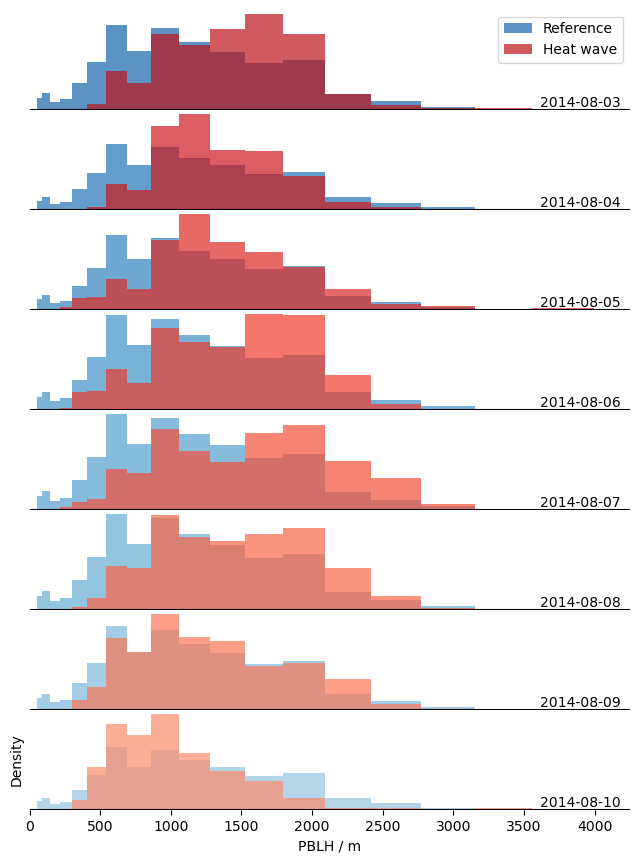
Figure 1. Empirical distributions of daily maximum boundary layer heights during a heat wave in August 2014. The blue bars represent the reference, i.e., boundary layer heights taken from the same region on time steps without heat waves. Both sets are plotted with transparency, s.t., the overlapping region appears darker.
Main Results in 2024
The main focus in 2024 was on the European floods in July 2021, which caused severe damage, mostly in Belgium and Germany. In cooperation with project C01 we looked at mass budgets and how sensitive satellite gravimetry measurements would have been to the flood event. We showed that the instantaneous atmospheric water mass was likely enough to have been detected, if the GRACE Follow-On mission would have been in a position to record the event.
Kracheletz, M., Liu, Z., Springer, A., Kusche, J., and Friederichs, P. (2025): Water mass variations during severe flooding in Western Europe July 2021 and their influence on gravity field measurements by satellite missions. J. Geophys. Res. doi: 10.1029/2024JD042190
To understand the drivers of the event, we are performing so called storyline simulations in collaboration with project D03. With a storyline, the idea is to simulate extreme events under different scenarios. Often, such events are investigated with respect to greenhouse gas concentrations and global warming, e.g.: How would the event have turned out in a 2°C warmer or colder world? Aligning with the central hypothesis of DETECT we chose to specifically look at the water cycle instead. Our question is: How sensitive is the precipitation during the event to soil moisture?
To answer this question we created counter-factual scenarios with increased and decreased soil moisture levels. Additionally, we disabled the coupling between soil moisture and the atmosphere in some runs for comparison. An example can be seen in figure 2. Here we initialized the numerical weather prediction model ICON a few days before the event. For our changes to take effect on the atmosphere one to two days of simulation are required. Around the height of the event, we see a non-linear, positive response of precipitation to soil moisture. We are currently working on adding moisture tracking to our simulations to quantify the relationship better. The changes we make to the surface’s water budget are rather strong compared to what we expect from land use and land cover changes. However, our simulations let’s us estimate how much response we might expect in following scenario runs. A publication is in preparation.
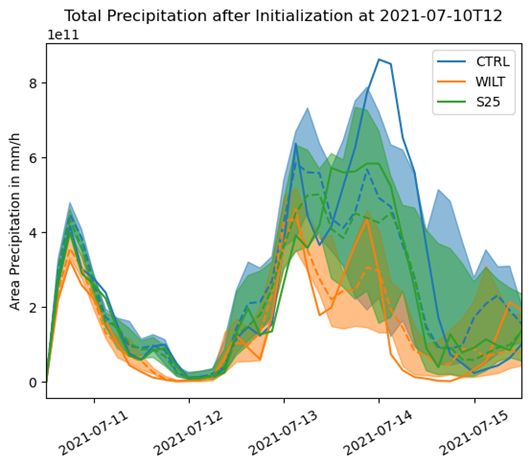
Figure 2. Time series of total precipitation in our study area centered on the region with the most impacts during the July 2021 floods. Shown are three examples of free forecasts with different forced soil moisture levels. “WILT” means plant wilting point and “S25” is a scenario where the soil moisture is 25% between wilting point and saturation. Full lines are deterministic runs, the dashed lines ensemble medians and the shaded areas represent the 25th to 75th percentiles.
Fohrmann, T., A. Valmassoi, and P. Friederichs (2025b): Influence of soil moisture on the development of the July2021 severe flood in Western Europe. In preparation.
Additionally, we expanded the investigation of the boundary layer height during heat waves to different data sets, such as the ERA5 reanalysis by ECMWF and radio sonde observations. Also, we added tracking data on temperature anomalies to our analysis, which allows us to investigate the effect of different driving processes on the boundary layer height. A publication is in preparation.
Fohrmann, T., S. Szemkus, and P. Friederichs (2025a): Evolution of the boundary layer height during heat waves over Europe. In preparation, to be submitted in 2025.
Main Results in 2025
In 2025 we refined our storyline approach. From the previous experiments, we found that starting the simulation a few days before the event is sufficient to see some impact on the heavy precipitation in July 2021. But, there is a trade-off here. Giving the soil more time to influence the atmosphere increases the signal, but comes at the cost of prediction accuracy. This motivated us to test ways of constraining the simulation without confounding the processes we are interested in. In the end, we achieved this with the use of observations.
In our global ICON run, observations are used to “correct” the atmospheric state everywhere except over Europe. In this way, the large scale circulation is constrained, but we still allow the system to develop freely enough over Europe. Using this approach allowed us to start our simulation 12 days ahead of the extreme event without loosing too much accuracy. Figure 3 shows a comparison between the unmodified control run and simulation with extremely low soil moisture. The red box marks our region of interest, where most of the event’s precipitation fell. Within this area, the dry run produced around 60mm less of precipitation, which is about half of the precipitation in the control run. This demonstrates how soil moisture was an important prerequisite of the heavy precipitation in July 2021. Interestingly however, saturating the soils with water did not impact the simulation results much. This is because evaporation during July of that year was not limited by water availability, but by solar radiation.
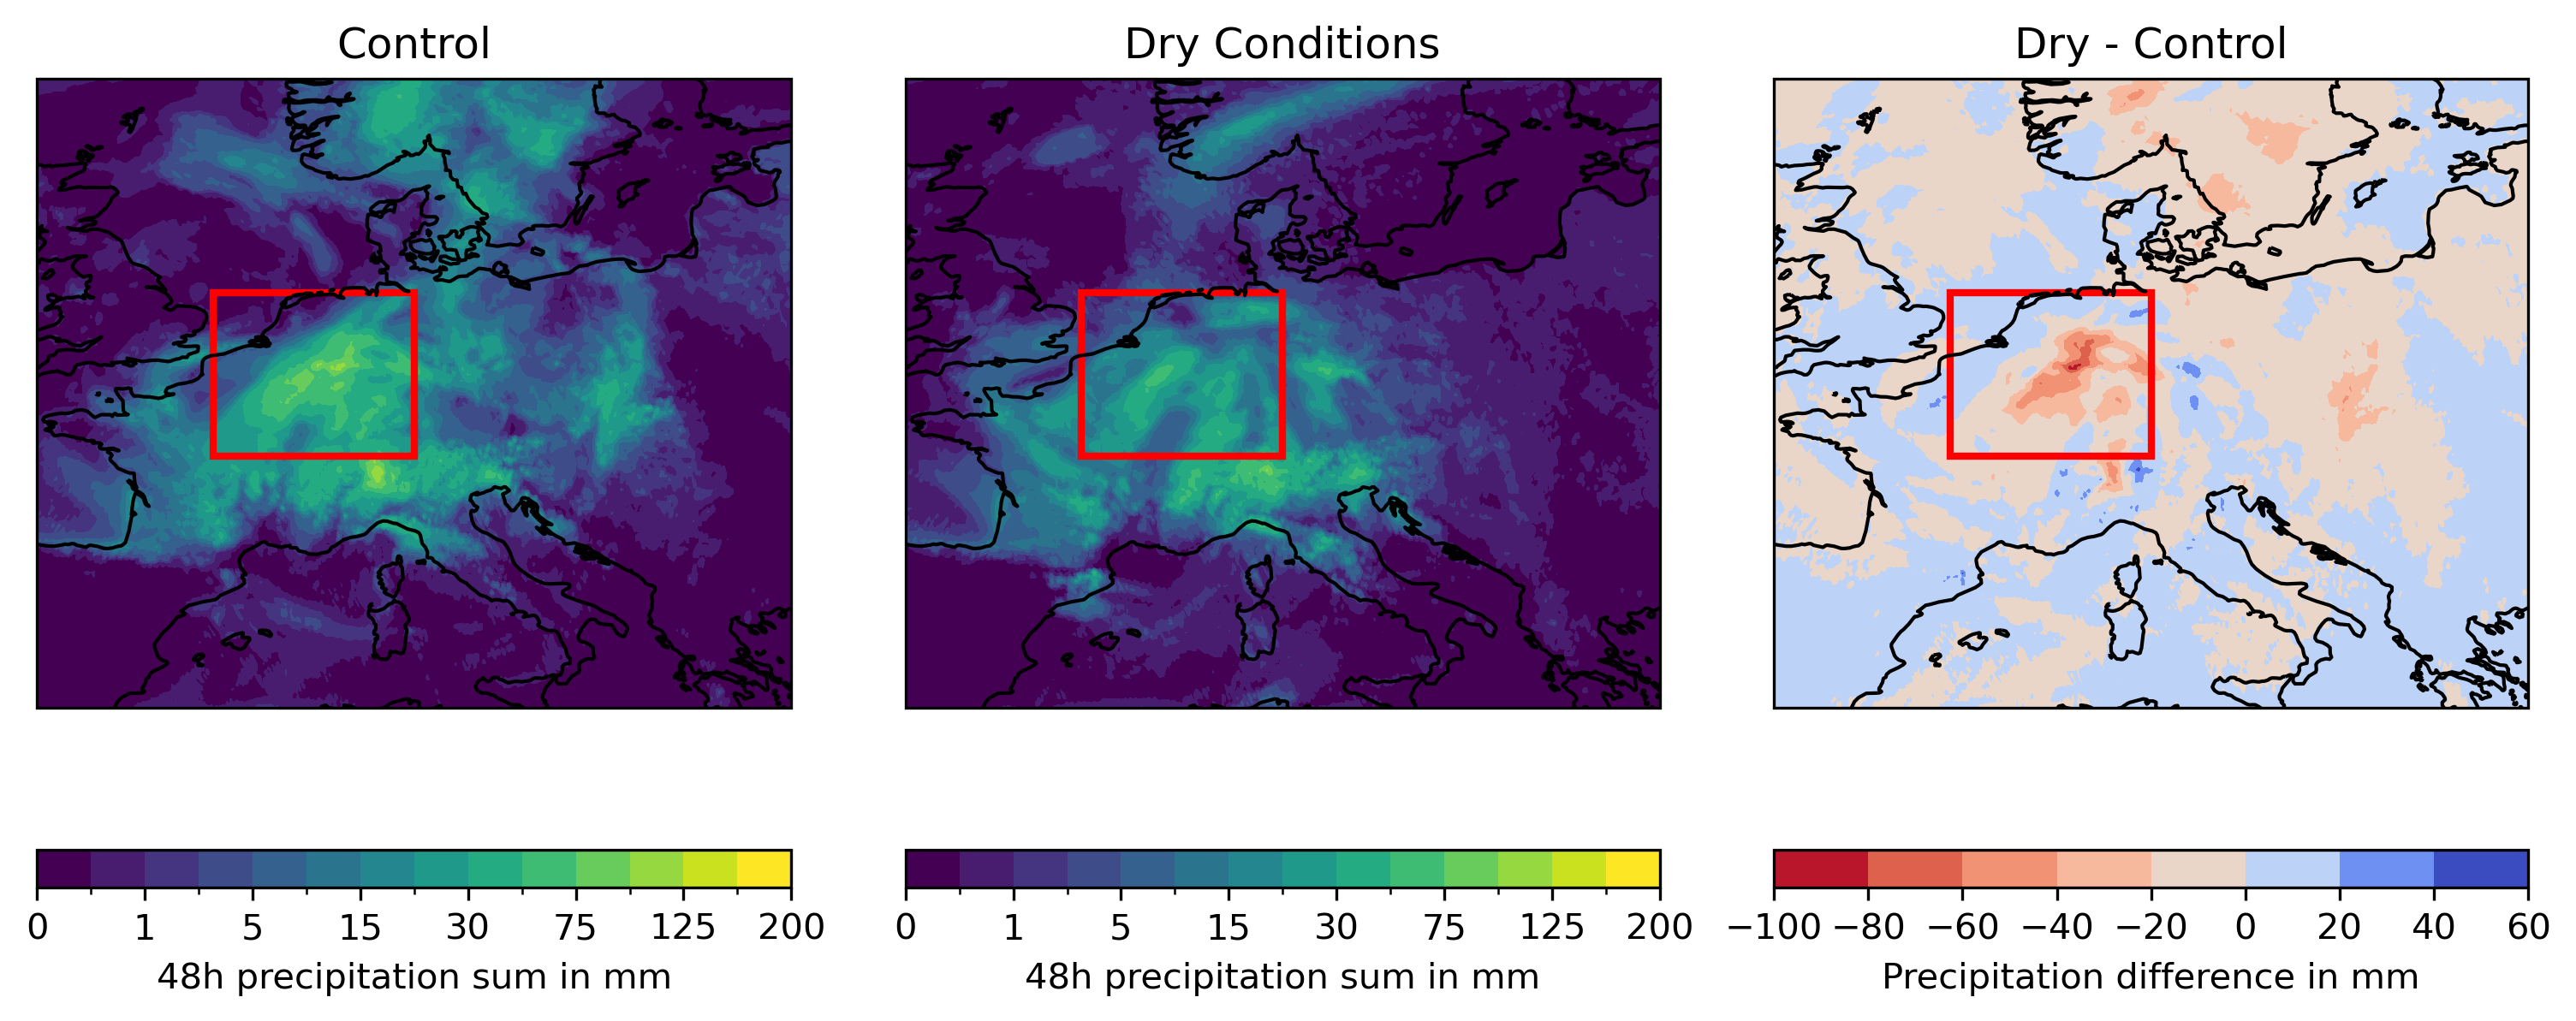
Figure 3: Comparison of precipitation summed over the event’s duration in the control and the dry soil moisture simulations.
Another important milestone in 2025 was complementing our study by moisture tracking. The tracking results confirm the importance of continental moisture sources, although the Atlantic is a major source, too. Adding the tracking was only possible because we managed to push the simulation start towards the beginning of the month. Otherwise, it would not have been possible to identify the source regions of most of the precipitation.