A04
Precipitation processes
PD. Dr. Silke Trömel
University of Bonn | +49-228-73779 |
Dr. Julián Alberto Giles (PostDoc)
University of Bonn | +49-228-735199 |
Summary
Atmospheric models still do not adequately represent precipitation generating processes and previous studies identify cloud and precipitation processes as one of the largest uncertainties in current weather and climate prediction models. This incomplete representation of precipitation generating processes is assumed to be at least partly responsible for their inability to reproduce observed regional patterns of drying and wetting. We compared different precipitation datasets covering the European domain and then evaluated the simulated precipitation and precipitation trends against them. We then aimed to relate the trends in precipitation with trends in terrestrial water storage (from satellite observations and reanalysis) and found significant discrepancies, suggesting complex dynamics which could be linked to glacier melt, topographical influences and/or human water use (i.e., irrigation), and still require further investigation.
We focus on Germany and Türkiye, two countries with contrasting climate regimes and hydrological trends, which are monitored by modern polarimetric radar networks. Microphysical properties such as mean volume diameter (Dm), total number concentration (Nt), and ice/liquid water content (IWC/LWC) were analyzed using contoured frequency-temperature diagrams. Observations show that Dm increases with temperature due to riming and aggregation, Nt decreases toward the melting layer (ML), and IWC and LWC show site-dependent patterns that may be influenced by processes like evaporation, coalescence, and seasonal sample biases. Simulations differ from observations by showing fewer but larger particles above the ML and differing IWC gradients, indicating differences in aggregation and riming intensities but potentially also modeling deficiencies, e.g. in the ice nucleating scheme that requires further investigation. Contoured frequency-temperature diagrams of radar moments reveal consistent vertical profiles across German radar sites, while Turkish sites exhibit more variability. Germany shows stronger gradients of reflectivity above the ML, indicating more intense riming and aggregation, with notable seasonal changes across all sites. Stratiform events with dominating riming processes—more frequent in summer and more common in Germany—are associated with higher, colder cloud tops, sagging MLs, and distinct radar signatures, patterns observed consistently across both regions. These observational findings are now being further exploited for model evaluation and improvements. Whether the regional differences are influenced by anthropogenic interventions in the land-atmosphere system remains to be investigated also with supporting scenario simulations.
Graphical Summary
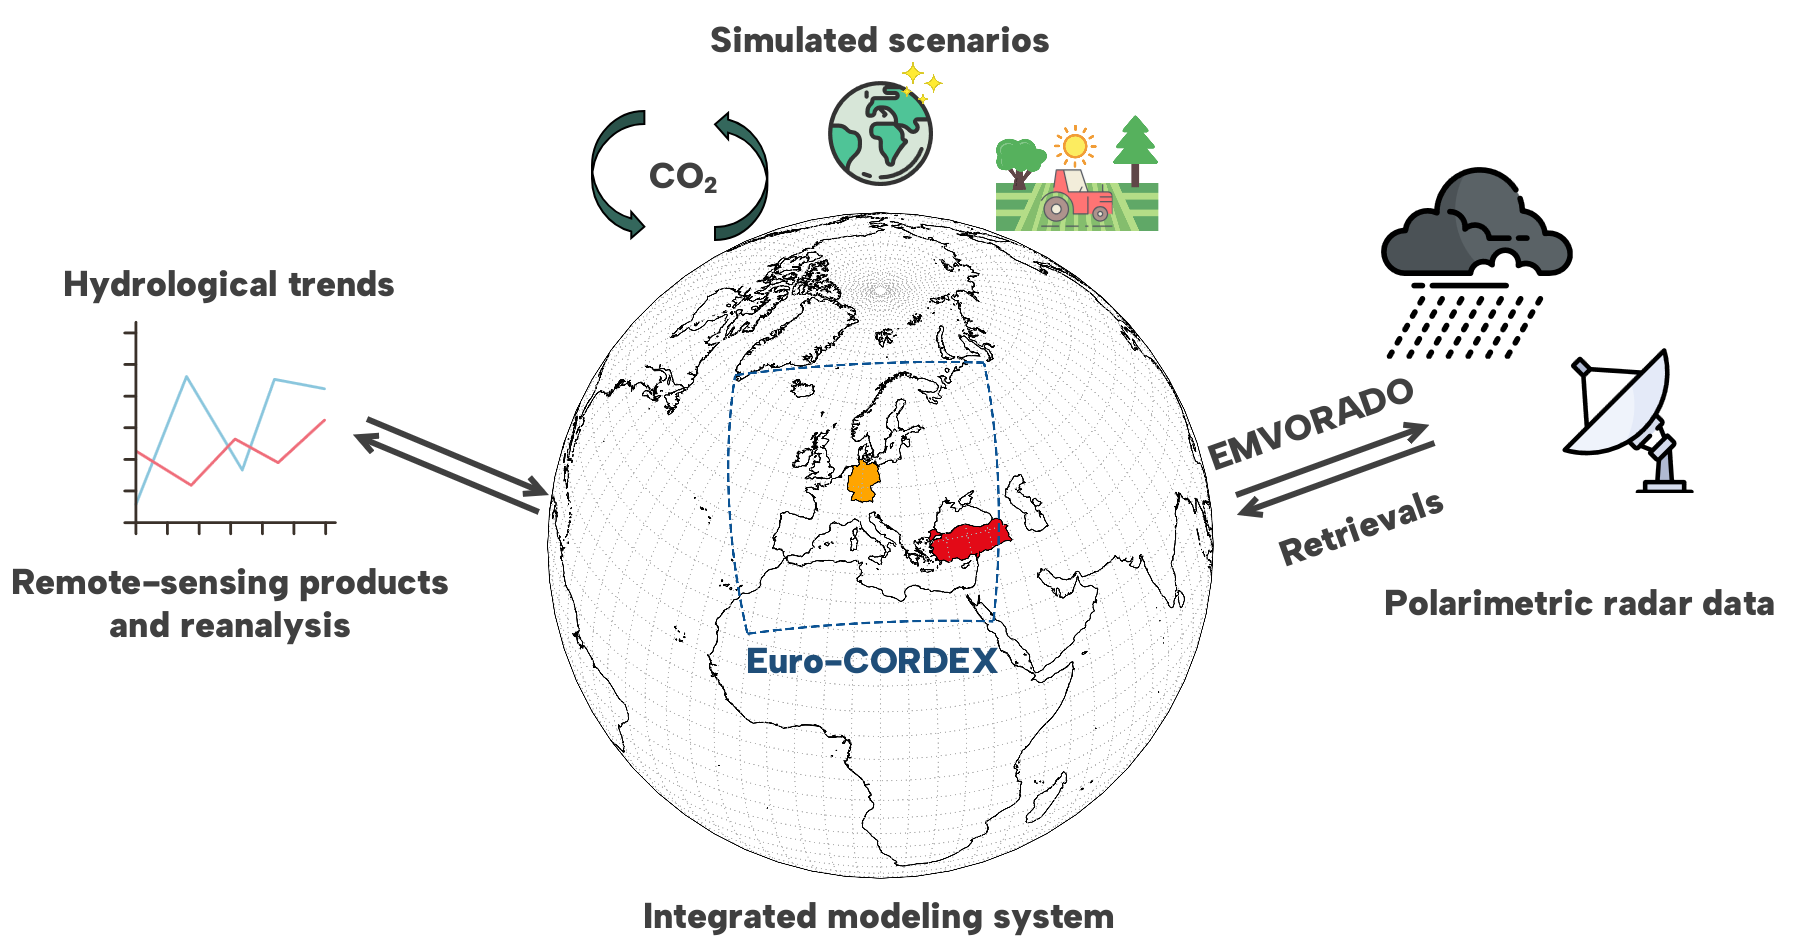
Contribution to CRC
The project contributes to the CRC’s key objectives by investigating deficiencies in precipitation generating processes and feedback mechanisms in the modeling platform, and the impact of anthropogenic modifications on precipitation generating processes and microphysical characteristics. Overall, we work on the model simulation scenarios and reanalyses provided by other projects and produce a detailed analysis of precipitation characteristics.
Approach
The project analyzes six years of radar data (2015-2020) from three radar sites in Germany and five in Türkiye. Using the EMVORADO radar forward operator, synthetic radar observations are generated to evaluate model simulations.
We compare model simulations with the Integrated Modeling System (IMS), publicly-available precipitation products, and polarimetric radar observations across Germany and Türkiye. We focus on trends, microphysical properties, and precipitation-generation signatures. By examining these in relation to terrestrial water storage (TWS) trends from reanalysis data, we aim to uncover if model inaccuracies in precipitation trends contribute to disparities with observed TWS trends.
Microphysical data—like mean volume diameter, water content, and hydrometeor types—are derived from radar data and compared to model simulations to detect potential biases. Further, we explore the impacts of anthropogenic influences by assessing differences in simulated rain rates, water content, and particle types across historic climate scenarios.
Through these comparisons, particularly between observed and simulated radar data, the project seeks to improve our understanding of model limitations in capturing human-driven changes in precipitation patterns.
Main Results in 2022 - 2025
Observed and modeled hydrological trends: Originally, the IMERG precipitation product (Huffman et al., 2023) was considered the best reference dataset freely available covering the European domain. However, considerable biases were found between IMERG and other precipitation products derived from rain gauges, satellite observations, ground radars, and reanalysis. This led to an unplanned effort to explore the suitability of IMERG as a reference dataset, with special emphasis on the focus regions Germany and Türkiye. This effort is not only important for the trend analysis but for proper validation of the simulations. Over Germany, a country with a large observational network, all rain-gauge based datasets (HYRAS, E-OBS, GPCC, CPC) perform similarly, with radar-based German products (RADOLAN RW, RADKLIM) coming closely behind, for yearly to daily precipitation accumulations. GSMAP is the best-performing satellite product, while IMERG V07B does not perform better than the ERA5 reanalysis. Over Türkiye, a country with a less dense observational network, the observational uncertainty is larger and IMERG V07B performs similarly to CPC and GSMaP. The full European domain is only covered by a small sample of datasets, also depending on the temporal resolution. Overall IMERG V07B performs slightly worse than E-OBS in yearly and monthly accumulations (reference: GPCC), but similarly to ERA5, EURADCLIM or CPC and better than other satellite products. All in all, there are better-performing datasets that can be used for evaluation over Germany, while IMERG remains among the best satellite-based estimates for other regions where other products are not available. See Hammoudeh et al. (2025) for details on the results for Germany at daily scale.
As a next step, we aimed to relate simulated/observed trends in precipitation to trends in reanalyses of TWS and IMS-simulated TWS to elucidate whether insufficiently reproduced precipitation trends in the simulations explain the differing trends between the reanalysis of TWS and IMS model output. Fig. 1 compares modeled and observed TWS trends from GRACE (provided by D07), the C01 reanalysis and the D02 Baseline simulation with trends in selected precipitation products (IMERG V07B and GPCC) as well as with trends in the D02 Baseline simulated precipitation, for the period 2003-2020. The observational TWS from GRACE (Kvas et al. 2019) shows a drying trend over most of Europe, with a particularly strong trend in eastern Europe. A drying trend also covers most of Germany except the north. In Türkiye, drying trends are seen over most of the country except for the center-north which experiences a wetting trend. The TWS reanalysis shows an overall good agreement with GRACE except some localized differences. In Türkiye the drying trend observed in GRACE agrees quite nicely with the C01 reanalysis, except some differences in the East probably resulting from the fact that CLM does not simulate the large water level changes in water reservoirs or lakes. On the other hand, the D02 Baseline simulation clearly misses to correctly capture the TWS trends in several regions, most noticeably in central-eastern Europe, the Balkans and western Türkiye, among others.
Regarding precipitation, IMERG V07B and GPCC present similar trends over the whole domain and the D02 baseline simulation reproduces the observed trends to a certain degree (Fig, 1, second row). The south of Germany has a larger simulated positive trend compared to the observations. Most of Türkiye has simulated trends similar to the observed ones, except for some localized differences. The trends in precipitation do not directly relate to trends in TWS. For instance, a positive precipitation trend in the Alps and south of Germany contrasts with a negative trend in TWS, which could be related to melting glaciers (Güntner et al. 2023, their Fig. 7). A positive precipitation trend is evident in most of Türkiye except negative trends mainly in southwest and central and north-eastern Türkiye.
A research question is whether feedback mechanisms exist – i.e. changes in precipitation processes due to drying – which the model does not represent. If this is the case, we would expect larger differences in the modeled vs observed precipitation in Türkiye compared to Germany due to more anthropogenic modifications in Türkiye, however this is not observed. Nonetheless, this does not mean that changes in precipitation processes do not exist, only that the signal might not be as evident as originally expected. We continue in collaboration with D07 to understand the differences between TWS and precipitation trends.
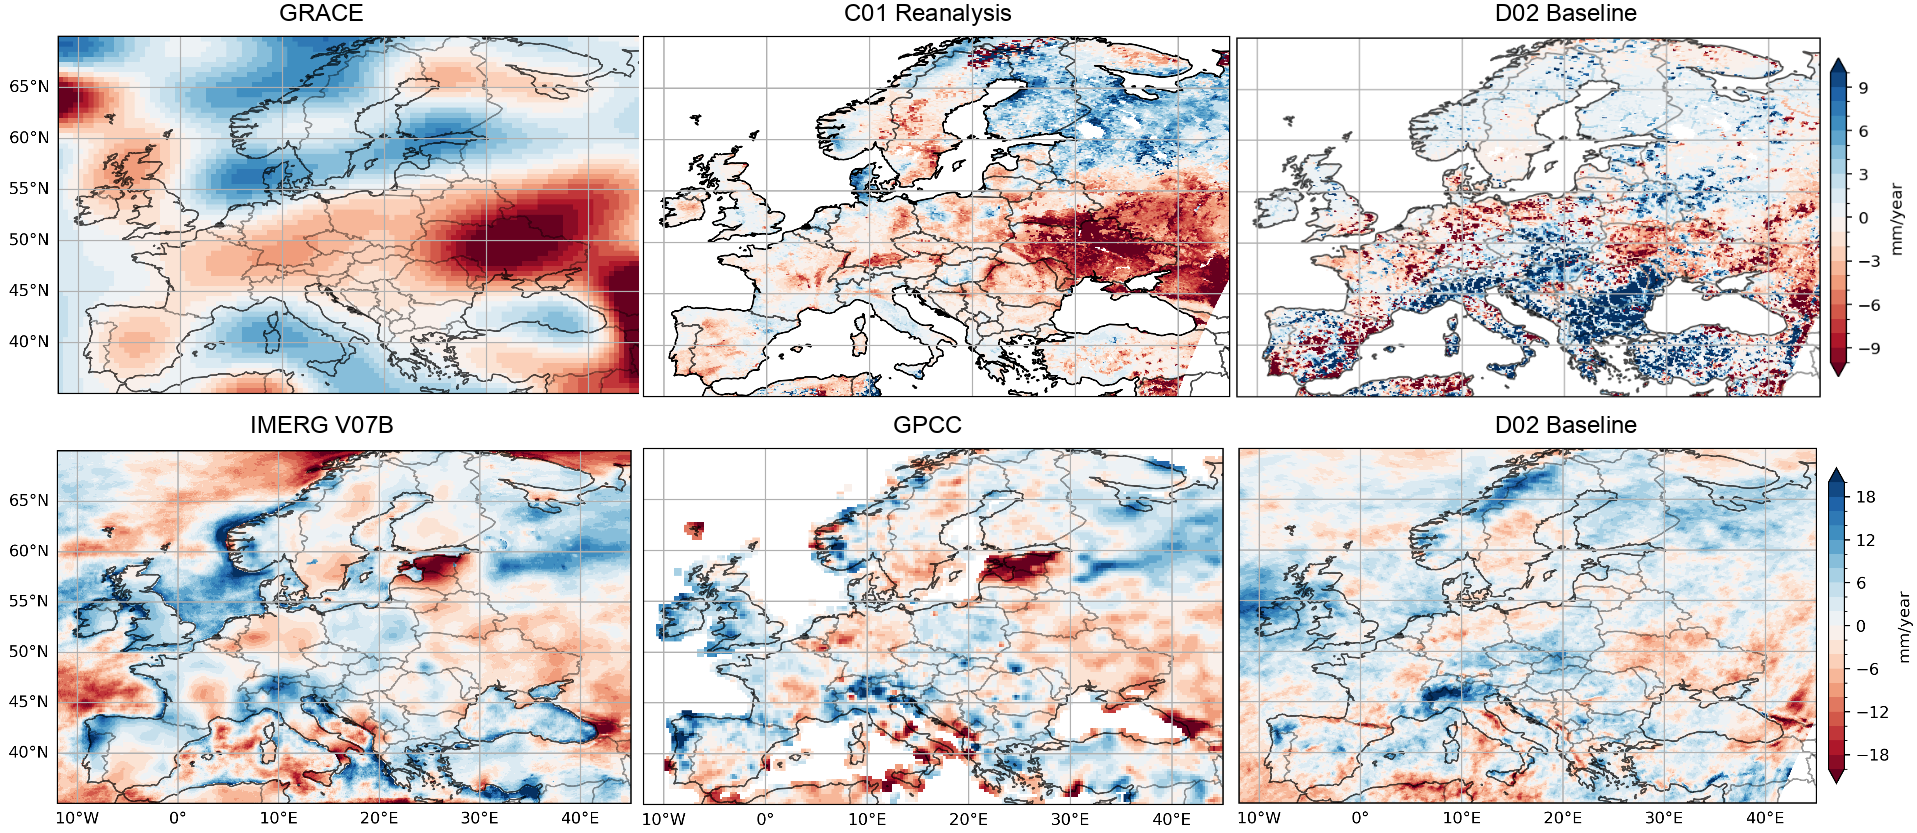
Fig. 1: 2003-2020 trends of: TWS (first row, GRACE, C01 Reanalysis, D02 Baseline simulation) and precipitation (second row, IMERG V07B, GPCC, D02 Baseline simulation).
Radar process signatures of stratiform events: C-band radar observations from three radar sites in Germany and five radar sites in Türkiye (chosen due to strong hydrological trends and deficiencies of the models to reproduce them) for the period 2015-2020 were acquired during the second half of 2022 and concluded in early 2023. Nobody analysed the polarimetric radar data from Türkiye before and thus required special attention and quality assurance. State-of-the-art methods for melting layer (ML) detection, stratiform classification, riming detection and microphysical retrievals were adapted and applied to the data (e.g., Trömel et al., 2023; Blanke et al., 2025) to produce contoured frequency-temperature diagrams of the radar variables horizontal reflectivity (ZH), differential reflectivity (ZDR), specific differential phase (KDP) and cross-correlation coefficient (RHOHV). While the average vertical profiles are similar among the German radar sites, some differences are found when comparing to the Turkish sites, which show more variability. For instance, the gradient of ZH above the melting layer (ML), which indicates the intensity of riming and aggregation processes, is larger in Germany than in Türkiye. This gradient also shows strong seasonal variability among all sites. The strength of the ML, measured by the maximum value of ZH and its difference to ZH below the ML, also shows a seasonal variation although the median values are similar among different sites. A riming detection algorithm identifies riming in around 20% of all stratiform events in Germany and is more frequent during summer than in winter. In Türkiye, riming is more variable between regions and has a stronger seasonality. Despite the regional differences in riming frequency, rimed stratiform events show at all sites (German and Turkish) higher and colder cloud tops, a sagging ML with respect to the height level, larger gradients and absolute values of ZH above the ML, lower values of ZDR directly above the ML, greater values of ZH and ZDR below the ML, and larger KDP values overall compared to non-rimed events (as seen in Fig. 2 for two example radar sites).
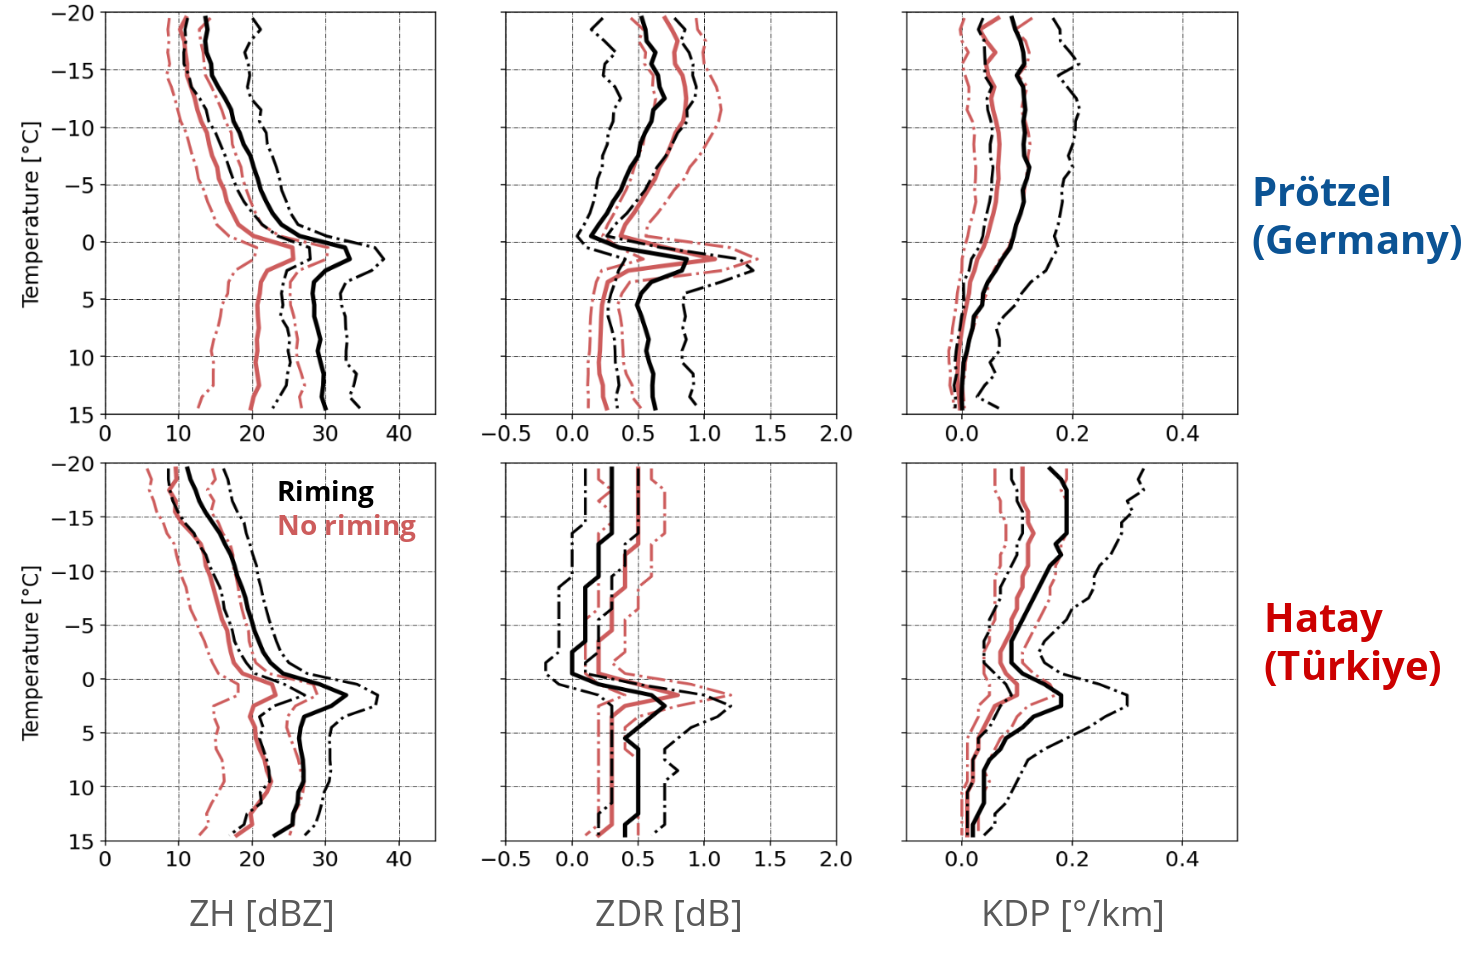
Fig. 2: Contoured frequency-temperature diagrams of radar-measured horizontal reflectivity (ZH), differential reflectivity (ZDR) and specific differential phase (KDP) for rimed (black) and non-rimed (red) stratiform precipitation events in one site in Germany (Prötzel, first row) and one site in Türkiye (second row). The bold line in the middle indicates the median of each distribution, while the dashed lines indicate the 20 and 80 percentiles.
To exploit these observational insights for model evaluation and improvement, high-resolution convection-permitting simulations are needed (currently available 11 km simulations lack the necessary resolution and rely on parameterized convection, which is incompatible with the forward operator EMVORADO). As an alternative plan, we (A04) engaged, in collaboration with Z04 and D02, in the online implementation of EMVORADO in ICON using the TSMP2 framework and prepared our own simulations for a dozen of precipitation events and produced preliminary results. For this purpose, the same set up as the D02 high-resolution simulations was used but only with the atmospheric component, i.e., TSMP2-ICON at ~3 km resolution in the Euro-CORDEX domain with ERA5 initial and boundary conditions. With collaboration from members of the DWD and PROM, we tweaked our simulations to the state-of-the-art configuration, including the use of a two-moment microphysical scheme. Comparing now observed and simulated precipitation events with respect to the observed and forward-simulated/synthetic polarimetric variables (Fig. 3), we see that the melting layer (ML) signature around the 0 °C level tends to be slightly wider and weaker in the simulations compared to the observations. Simulated ZDR is considerably lower above and in the ML but larger below the ML. The gradient of ZH above the ML seems to be correctly simulated in Prötzel (Germany), however this is not the case for Hatay (Türkiye). While observed ZDR and KDP tend to increase towards higher altitudes, polarimetric signatures above the ML are mostly missing in the simulations. These discrepancies can be at least partly explained by deficiencies in the ICON model, where too few ice particles produce large aggregates and additional excessive graupel production generates unrealistic ZDR profiles below the ML. Also, limitations of the T-matrix simulations in EMVORADO to produce appropriate polarimetric signals for fluffy low-density particles like snow are responsible for too small simulated ZDR and KDP values above the ML.
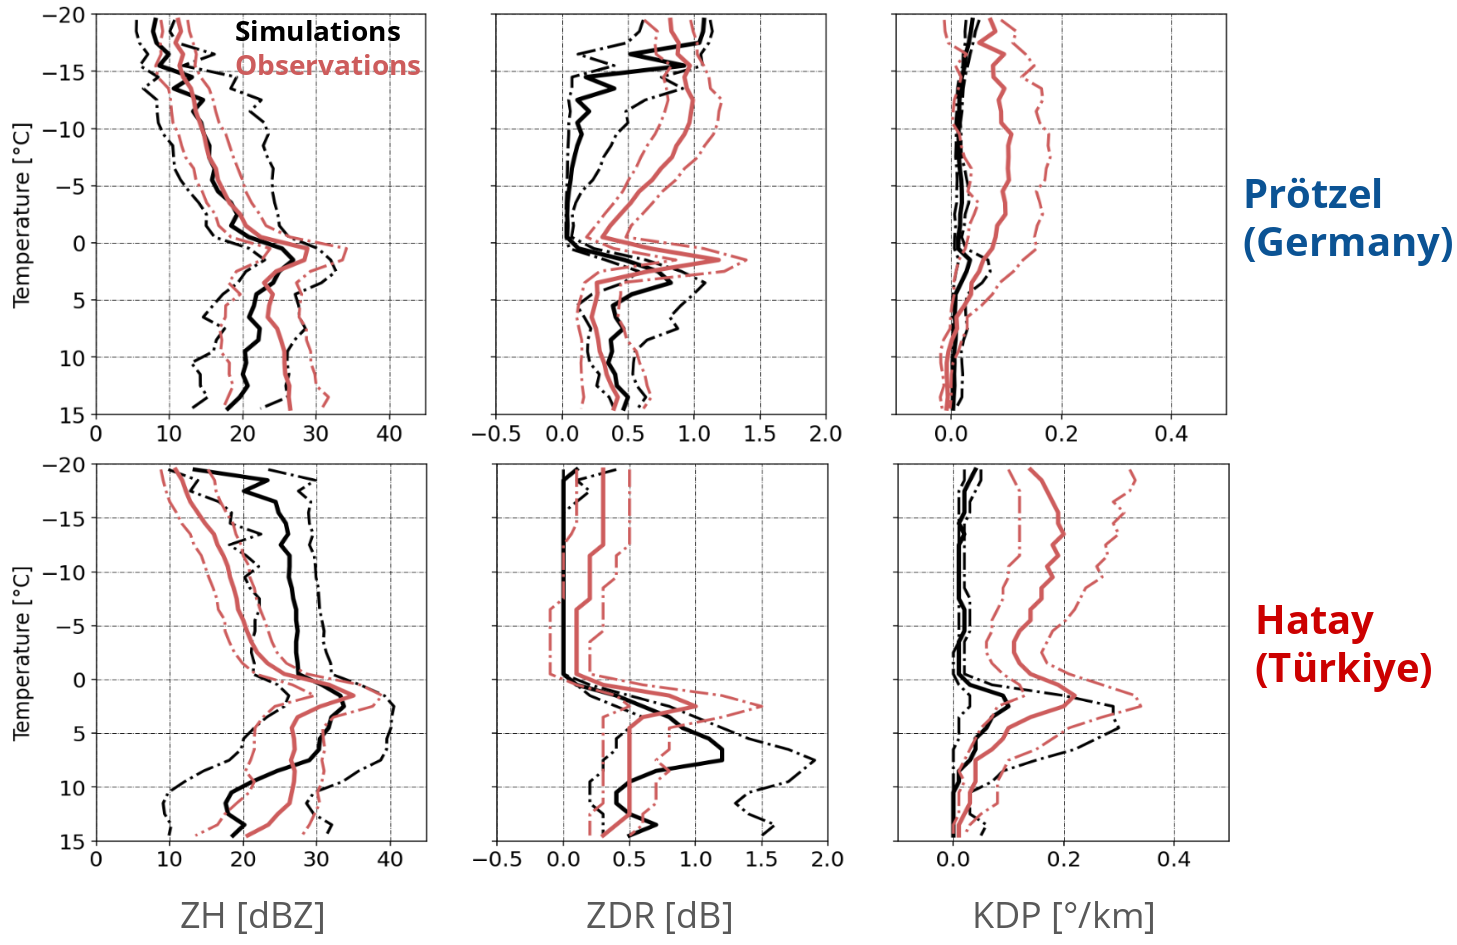
Fig. 3: Contoured frequency-temperature diagrams of horizontal reflectivity (DBZH), differential reflectivity (ZDR) and specific differential phase (KDP) for simulated (black) and observed/radar-measured (red) stratiform precipitation events at one site in Germany (Prötzel, first row) and one site in Türkiye (second row). The bold line in the middle indicates the median of each distribution, while the dashed lines indicate the 20 and 80 percentiles.
Additionally, polarimetry-derived microphysical retrievals of mean volume diameter (Dm), total number concentration (Nt) in logarithmic scale, and ice and liquid water content (IWC/LWC) are compared with their simulated counterparts (Fig. 4). Observed Dm increases with increasing temperature, consistent with particle growth due to riming and aggregation processes, reaching values between 1-4 mm with variability among radar sites. Dm values below the melting layer (ML) concentrate around 1 mm. Observed Nt is mostly constant in Prötzel but diminishes towards the ML, consistent with faster-falling particles and aggregation. IWC shows considerable variability among radar sites in the general statistic of all radar sites. Radar-derived IWC diminishes towards the ML at two of the Turkish sites, as expected in the absence of significant precipitation generating processes and assuming constant precipitation flux, although there is also a slight increase in IWC in the dendritic growth layer (layer between -20 to -10°C). The other Turkish and the German radar sites, however, either do not show a strong gradient in IWC or show a slight increase towards the ML (like shown in Fig. 4). LWC typically diminishes towards the surface/warmer temperatures, which could be due to evaporation or coalescence processes but also because the sample size of events in warmer temperatures is biased towards summer events. Simulations show smaller Nt values above the ML and an S shape with a relative maximum around -5 C. This is related to secondary ice production which is confirmed by looking at the contributions from each hydrometeor separately (not shown). The shapes of simulated Dm profiles also do not match the observations. By looking at the contributions from graupel (not shown) it is clear that the model produces too much graupel particles. These particles grow rapidly in quantity although not in size, overshadowing the contributions by other hydrometeors and producing differing IWC profiles. This process seems to be exacerbated in Hatay, where the IWC grows rapidly to values considerably larger than in Prötzel. The more intense graupel production in Hatay could be associated with the observed tendency to more riming processes in Hatay. This would mean that the model is following the observed regional difference, although it is overdoing it resulting in extreme IWC profiles.
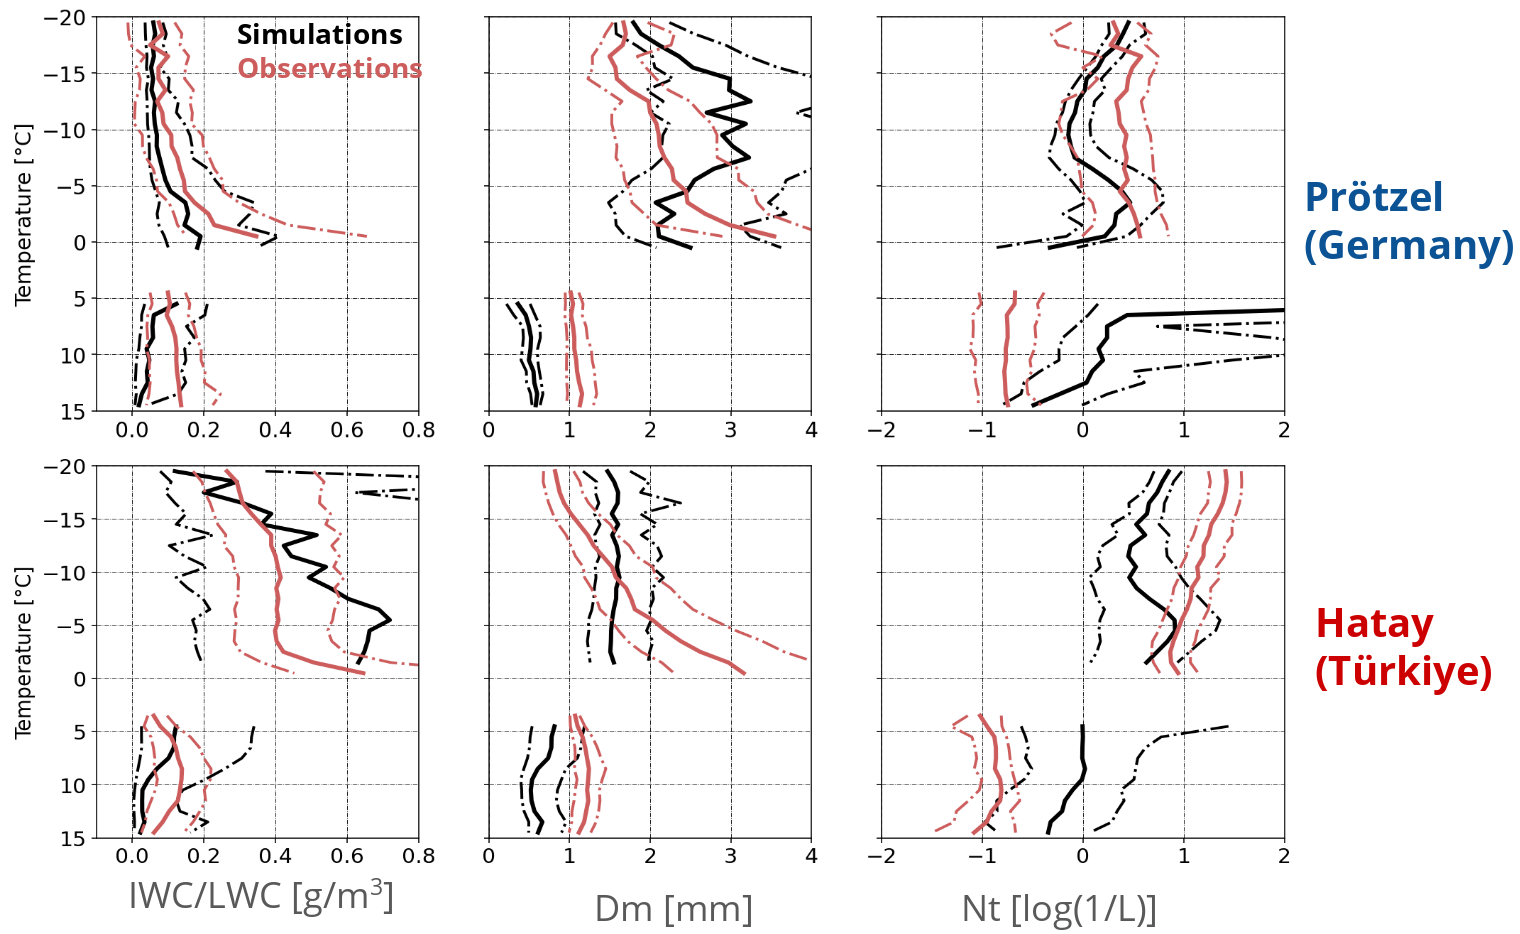
Fig. 4: As in Fig. 3 but for ice/liquid water content (IWC/LWC), mean volume diameter (Dm) and total number concentration (Nt).
Observed and simulated anthropogenic impact on precipitation processes: For this task we have so far focused on the Turkish radar sites because of the more contrasting hydrological trends. We find differences in the average profiles of ZH, ZDR and KDP (not shown) between the radar in Sivas, at the center-north of Türkiye covering an area with a wetting-to-neutral hydrological trend, compared to the radars in the center south of Türkiye (Hatay and Gaziantep), covering an area with a drying trend. The plan is to analyse the potential impact of anthropogenic modifications on the precipitation-generating processes as well as the ability of the model to reproduce wetting and drying trends by comparing different modeled scenarios (e.g., the baseline control simulation versus the simulations with land use change and water use/management). For this purpose, the simulations need to be configured in convection-permitting high-resolution, in order to capture the fine details of the microphysical processes. This is currently under development.
References
Blanke, A. M. Gergely, and S. Trömel, 2025: A new aggregation and riming discrimination algorithm based on polarimetric weather radars. Atmos. Chem. Phys., 25(7), 4167-4184, https://doi.org/10.5194/acp-25-4167-2025
Güntner, A., H. Gerdener, E. Boergens, J. Kusche, S. Kollet, H. Dobslaw, C. Hartick, E. Sharifi, F. Flechtner, 2023: Veränderungen der Wasserspeicherung in Deutschland seit 2002 aus Beobachtungen der Satellitengravimetrie. Hydrologie & Wasserbewirtschaftung, 67, (2), 74-89, https://doi.org/10.5675/HyWa_2023.2_1
Hammoudeh S., Goergen K., Belleflamme A., Giles J. A. , Trömel S. and Kollet S., 2025: Evaluating precipitation products for water resources hydrologic modeling over Germany. Front. Earth Sci. 13:1548557. doi: 10.3389/feart.2025.1548557
Huffman, G.J., E.F. Stocker, D.T. Bolvin, E.J. Nelkin, Jackson Tan, 2023: GPM IMERG Final Precipitation L3 Half Hourly 0.1 degree x 0.1 degree V07, Greenbelt, MD, Goddard Earth Sciences Data and Information Services Center (GES DISC), Accessed: 03 April 2024, 10.5067/GPM/IMERG/3B-HH/07
Kvas, A., Behzadpour, S., Ellmer, M., Klinger, B., Strasser, S., Zehentner, N., & Mayer‐Gürr, T. (2019). ITSG‐Grace2018: Overview and evaluation of a new GRACE‐only gravity field time series. Journal of Geophysical Research: Solid Earth, 124. https://doi.org/10.1029/2019JB017415
Trömel, S., U. Blahak, R. Evaristo, J. Mendrok, L. Neef, V. Pejcic, T. Scharbach, P. Shrestha, and C. Simmer, 2023: Fusion of radar polarimetry and atmospheric modeling. In V. N. Bringi, K. V. Mishra, & M. Thurai (Eds.), Advances in Weather Radar, Volume 2: Precipitation science, scattering and processing algorithms (pp. 293–344). IET The Institution of Engineering and Technology, ISBN-13: 978-1-83953-624-3, https://doi.org/10.1049/SBRA557G.